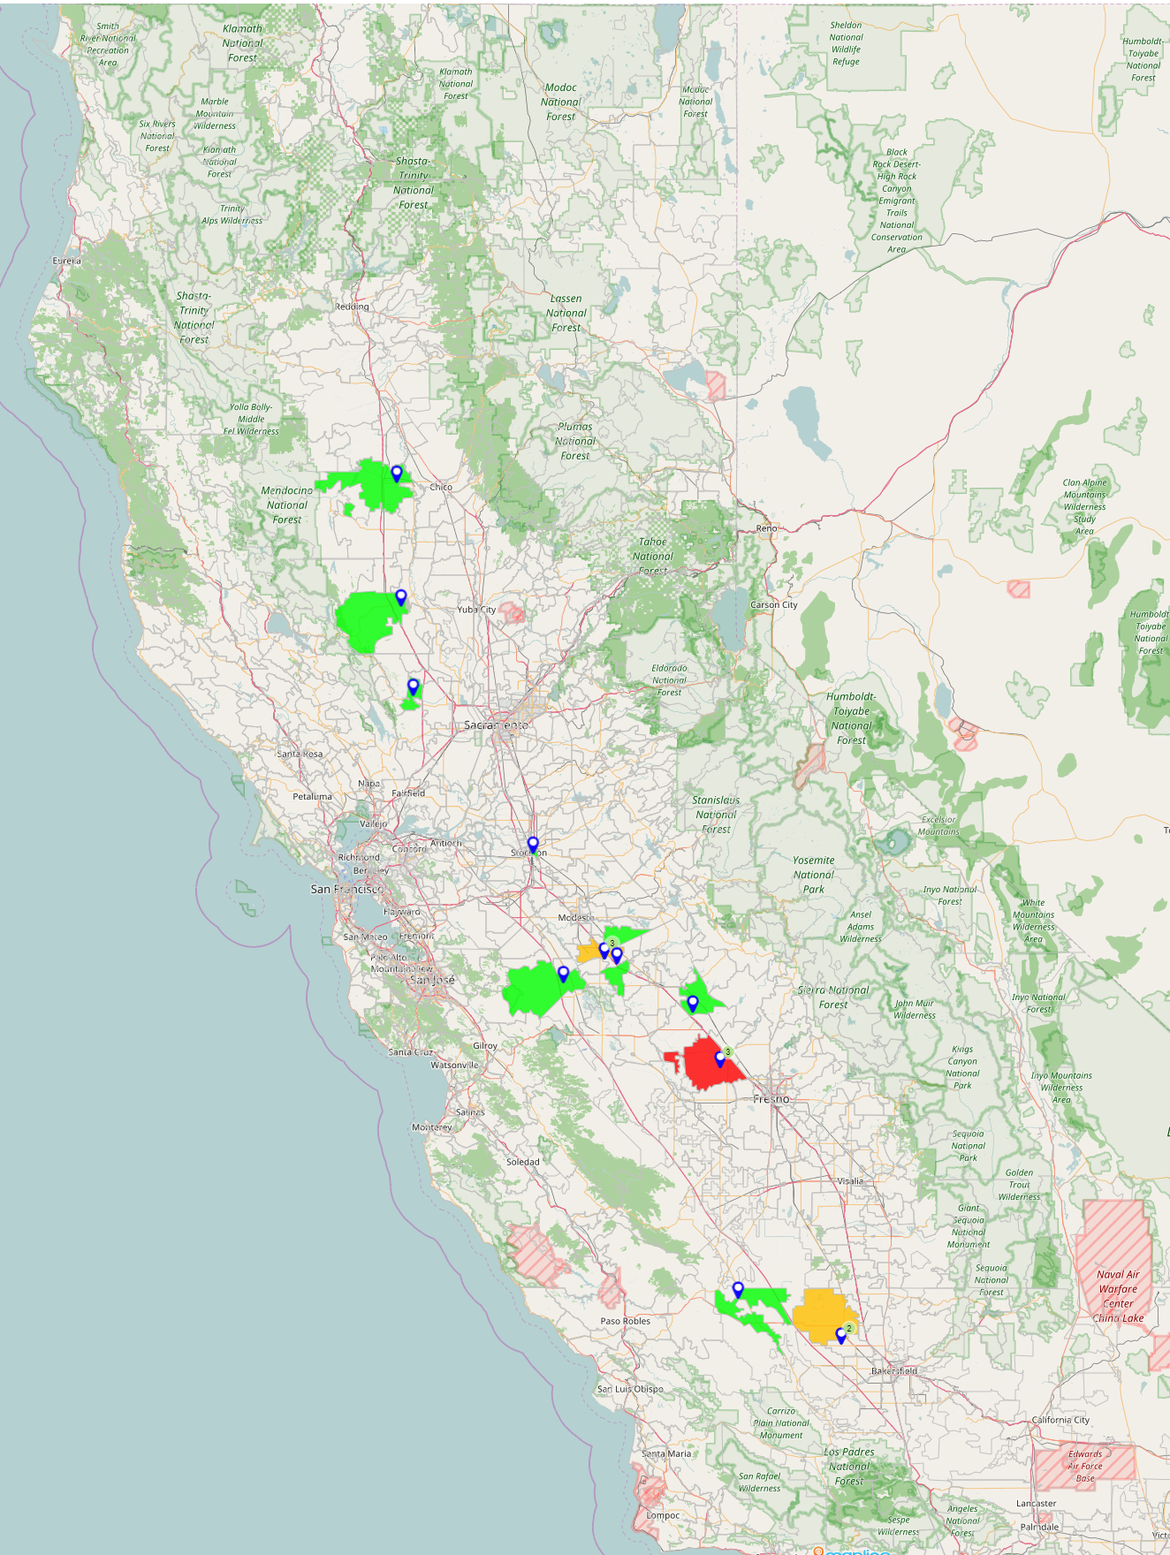
With the 2018 almond harvest started in California it's time for our machines to kick into high gear and gather quality data for the new crop. Below image shows the location and density of our machines all throughout CA.
As soon as the samples are run over our machines and data starts flowing in we'll get a clear picture on how exactly this year's crop compares to the previous one so stay tuned for further updates.